"During my internship, I created a dashboard for the content team that calculates and displays analytics for each self-learning activity. The dashboard contains statistical summaries, graphs, and charts detailing how long students spend on a given activity, as well as video engagement and quiz correctness, across different demographics (gender, location, age, time at TUMO). The content team will use this feature to see what's working and what's not for each activity, and modify activities based on student data."

Jade's Story
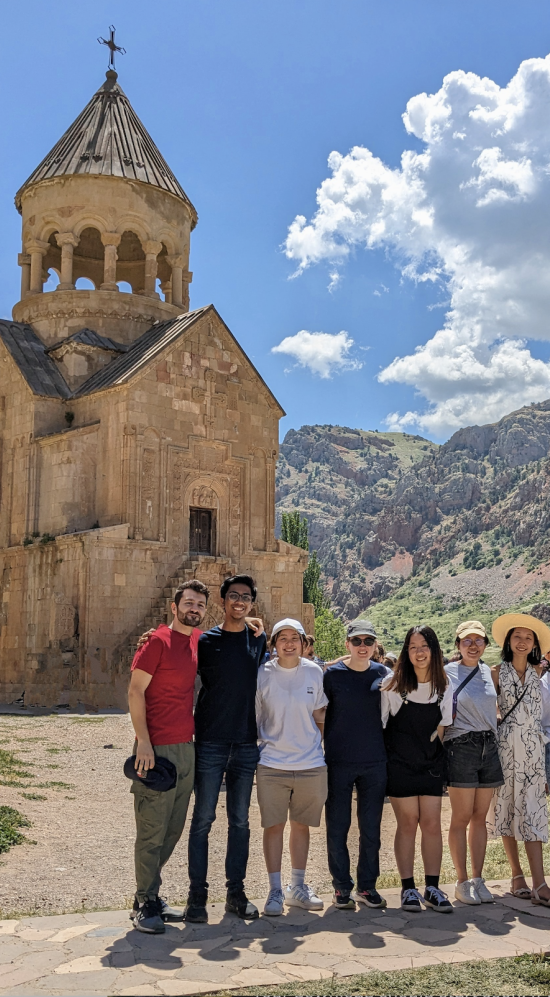
Jade Buckwalter '26 (pictured in all black and sunglasses), an electrical engineering and computer science major, interned at TUMO in Armenia, and it was her first internship abroad. She gained hands-on experience in software engineering and data analysis which confirmed that she would like to work in a smaller organization with a clear mission.
"I had a wonderful experience interning at TUMO, and in Armenia in general! This was a big step out of my comfort zone, but I couldn't be more glad I made the decision to go."Jade Buckwalter '26
Major & Class Year
Computer Science and Engineering '26
Location
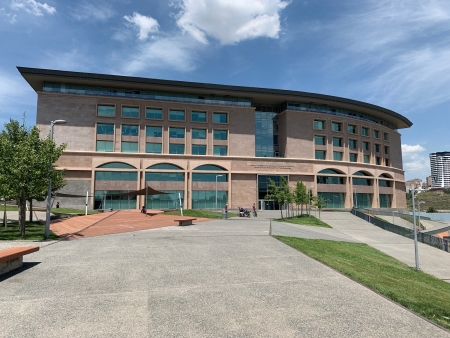
Yerevan, Armenia
MISTI program
Internships
MISTI Host
TUMO